

803-762-8989


WREN Insurance Network
Client Pension Reviews

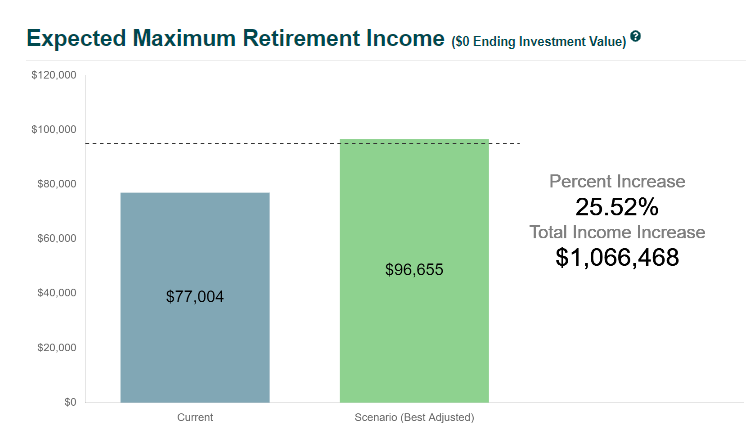
Expected Maximum Retirement Spending
This graph compares the after-tax income between plans at the selected success rate. As adjustments are made in the scenario, the income value in the corresponding green bar will go up or down. A record of the “best adjustment” income value is kept, represented by the number above the gray bar. Clicking on either the Current (blue) bar or the Scenario (green/gray) bar will reset the adjustments to that plan’s settings.
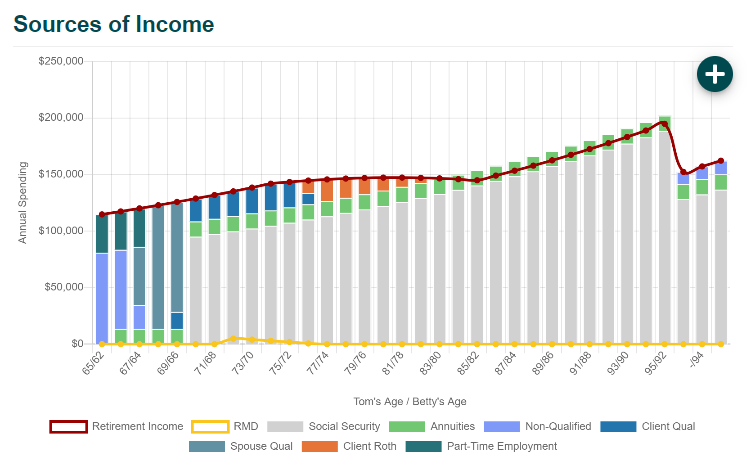
Sources of Income
This graph represents the income sources in each year of retirement. This may be made up of protected income sources (e.g. Social Security, pension, annuities, etc.) and then, to the extent available, the client’s investment portfolio. The “sequence of withdrawals” from the portfolio is: required minimum distributions, withdrawals from non-qualified assets, withdrawals from qualified retirement accounts, and lastly from Roth retirement accounts. Hovering over a section of the bar graph will display the after-tax amount from that source in that year. Required minimum distributions from retirement accounts are represented by the yellow line. The red line signifies the total spending each year which reflects inflation and a spending taper if selected.
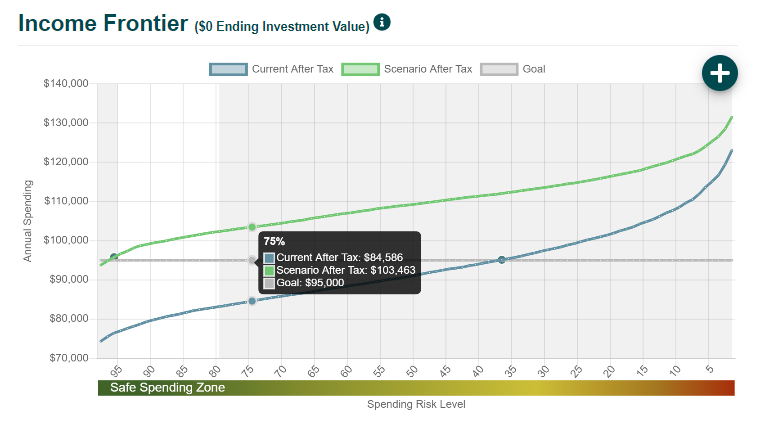
Income Frontier
This graph compares the after-tax income across every success rate for the current (blue) and adjusted (green) plan. The x-axis represents market performance as, moving left to right, unfavorable to favorable. The y-axis represents the annual spending for each plan. As shown below, for example, the current plan has a 75% likelihood of sustaining an annual spending level of $84,586. Showing how plans behave in varying potential market outcomes, one can determine if the adjustment(s) benefits the client based on where the two plans cross over. Ideally, the adjusted (green) plan would be above the current (blue) plan in all market conditions.
What Experts Say
"JourneyGuide illustrates whether or how the client's retirement plan outcome improves with the actual features of particular products.....isn't the ability to determine which products really do or don't help, exactly what good retirement planning software should be able to illustrate..."
Michael Kitces - Industry Expert
JourneyGuide is a new financial tool to determine how much income is needed at retirement and how much is available with current assets. It brings more transparency to a client’s retirement by taking them down a path of understanding with easy to comprehend metrics and impactful visuals. Being able to build a plan side by side with a client, instantaneously throw in those “what if” scenarios on the fly, and show the end result has been a game-changer. Clients love the co-planning experience JourneyGuide has created. And it's part of our FREE package!
Link to FREE
Zoom Meeting
Following are Examples of Charts Comparing Current Plan vs. Proposed Scenario
Link to FREE
Zoom Meeting